
Turn your notes into an infographic
Start with a title and a few key points. Your result is one portrait image; review its text before sharing.
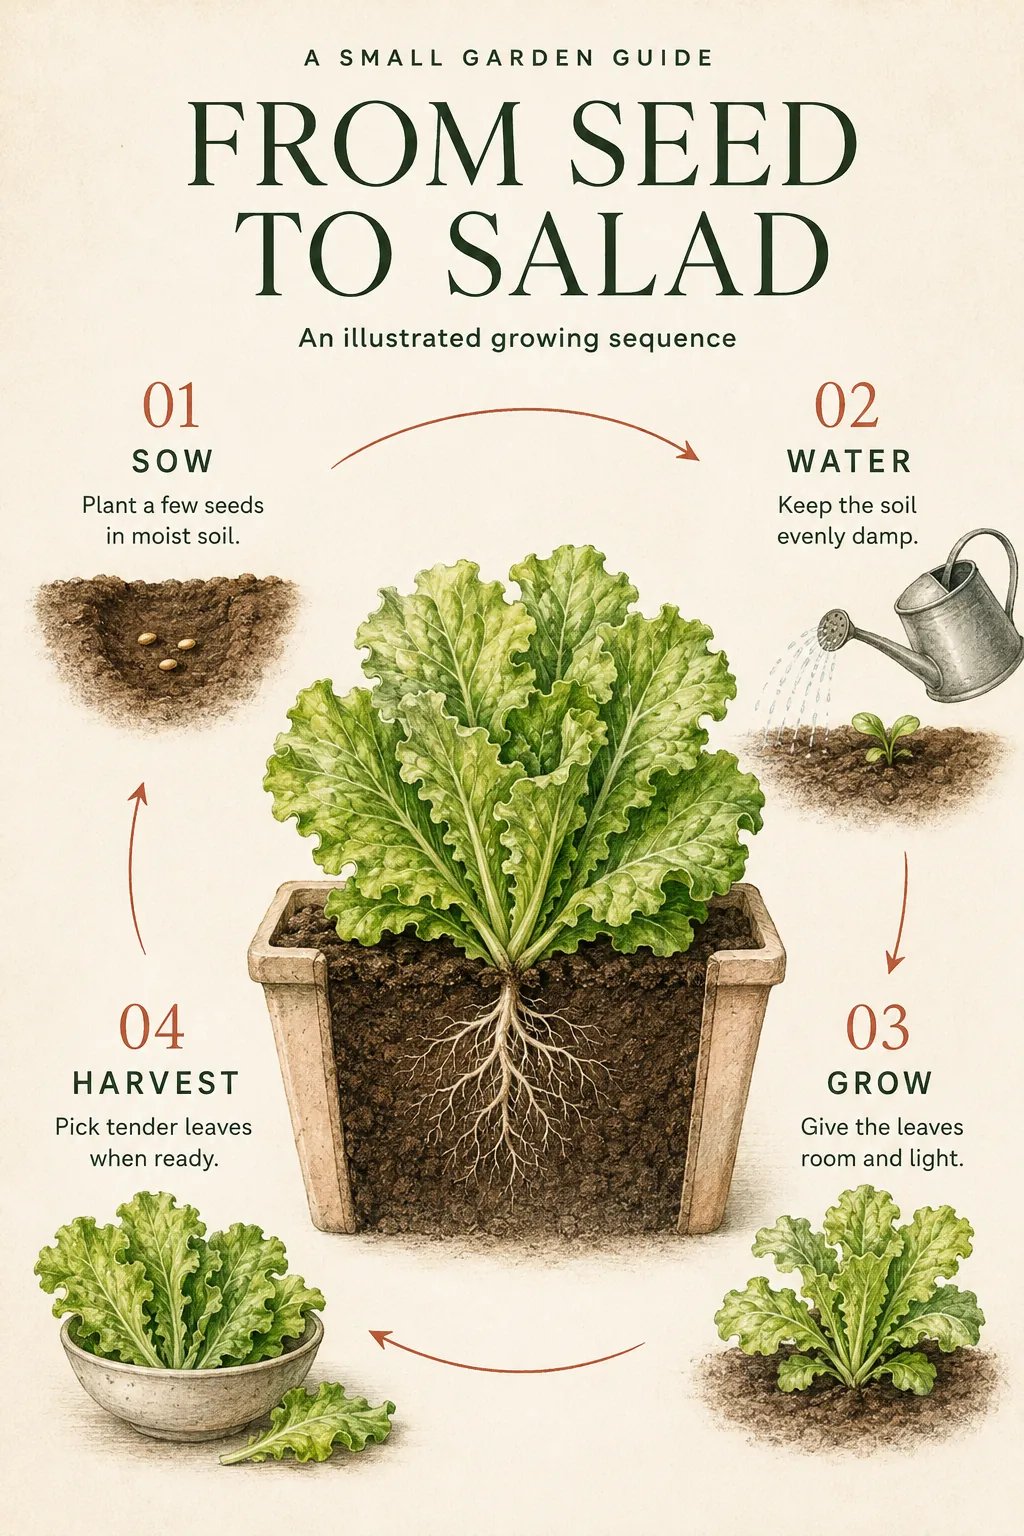
AI Infographic Generator: Turn Notes into Visuals
Turn complex notes and workflow steps into clean visual infographics with AI. Paste your key points, pick a layout style, and create illustrated guides.
Create an infographic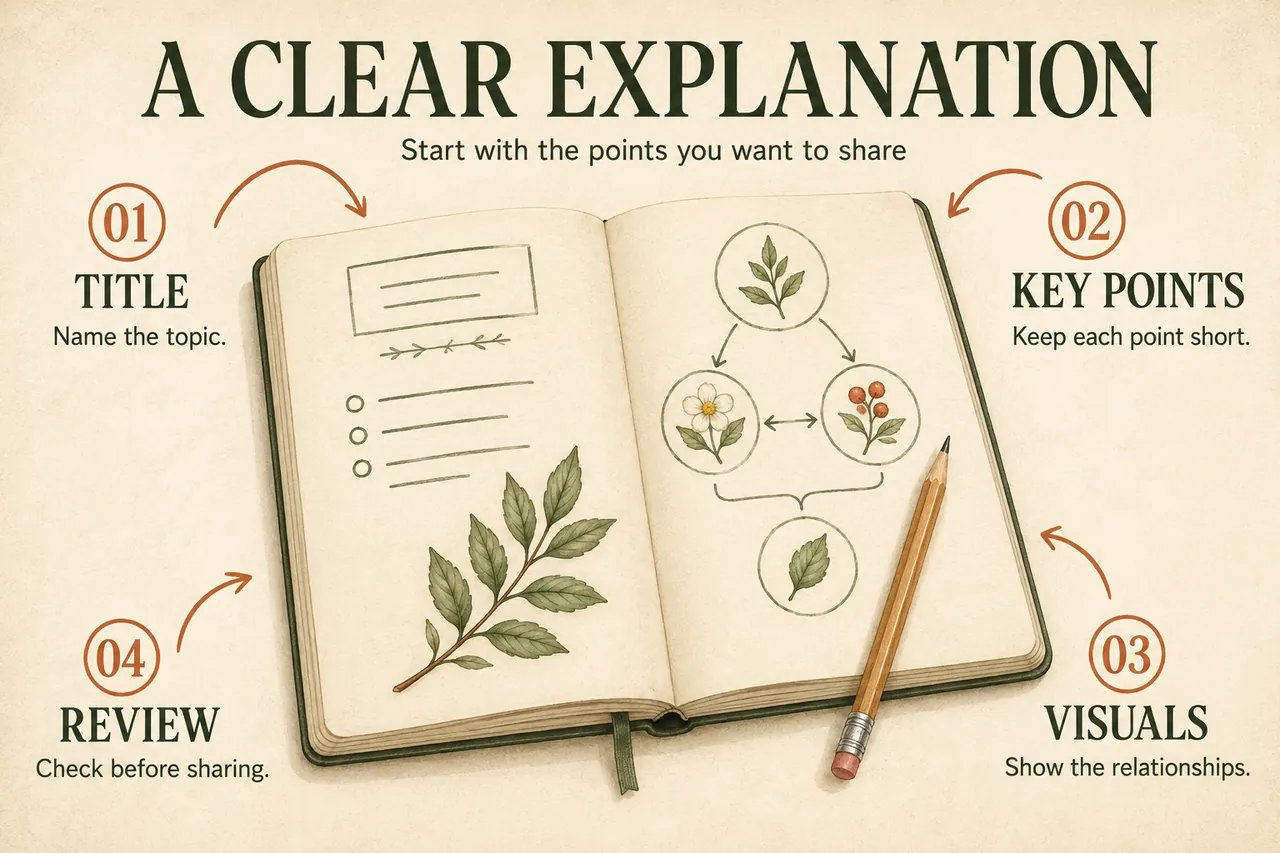
What does an AI infographic maker create?
An AI infographic generator is a prompt-based visual tool that transforms data concepts and instructional outlines into clear diagrammatic charts, visual cards, and informative graphics from text descriptions. Educators, marketers, and researchers describe core topics and visual hierarchy to render clean informational concept layouts in seconds.
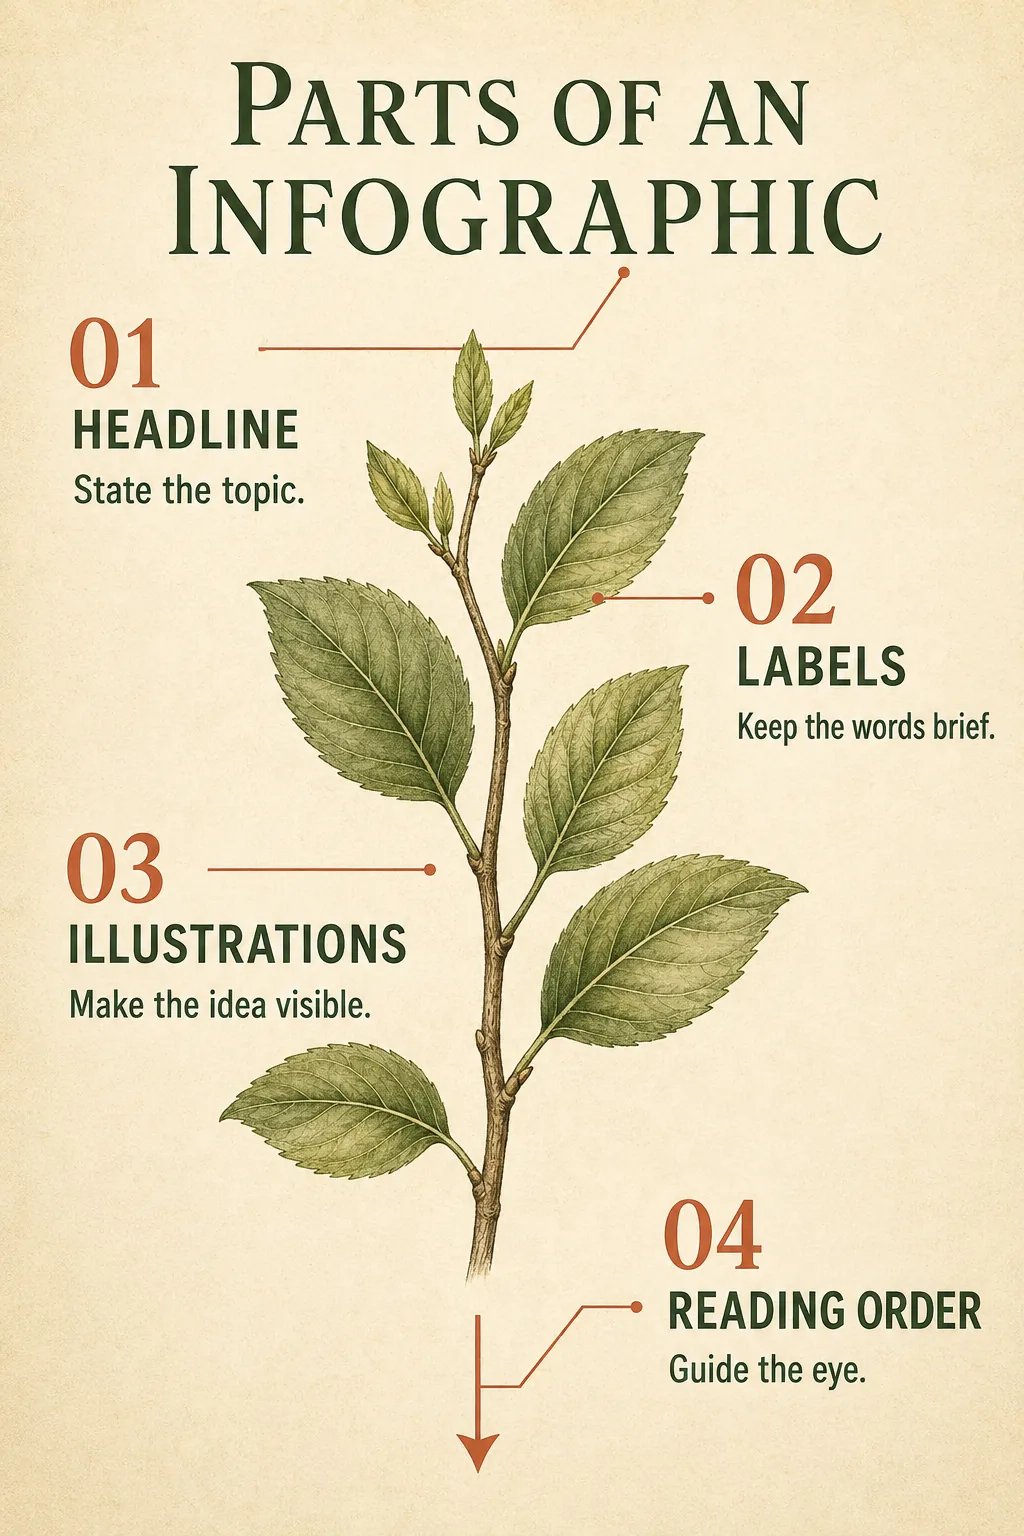
Give your ideas a clear reading order
Ask for numbered steps to explain a process, two columns to compare ideas, or a central illustration with short labels. State the order you want and keep each point brief. These directions guide generation; review the resulting layout and wording.
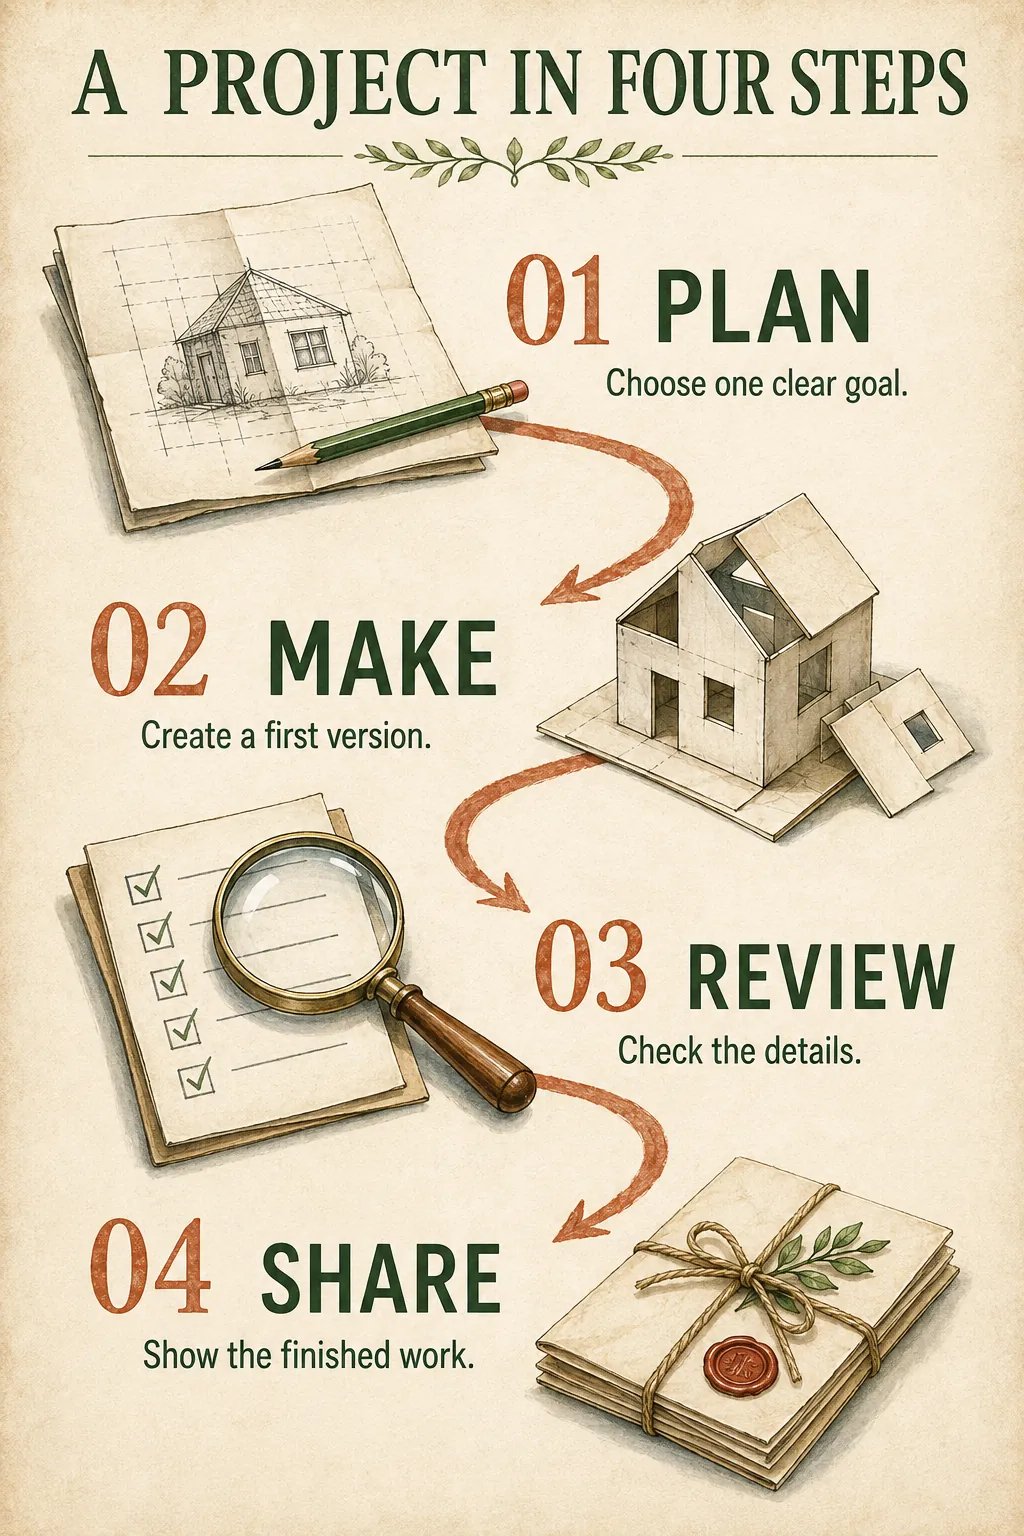
Finding it hard to explain a page of notes?
Start with one question your reader needs answered. Turn the answer into three to six short points, then choose a sequence or comparison. If the image feels crowded, shorten the labels in your prompt and generate another version. Each generation uses the displayed credits.
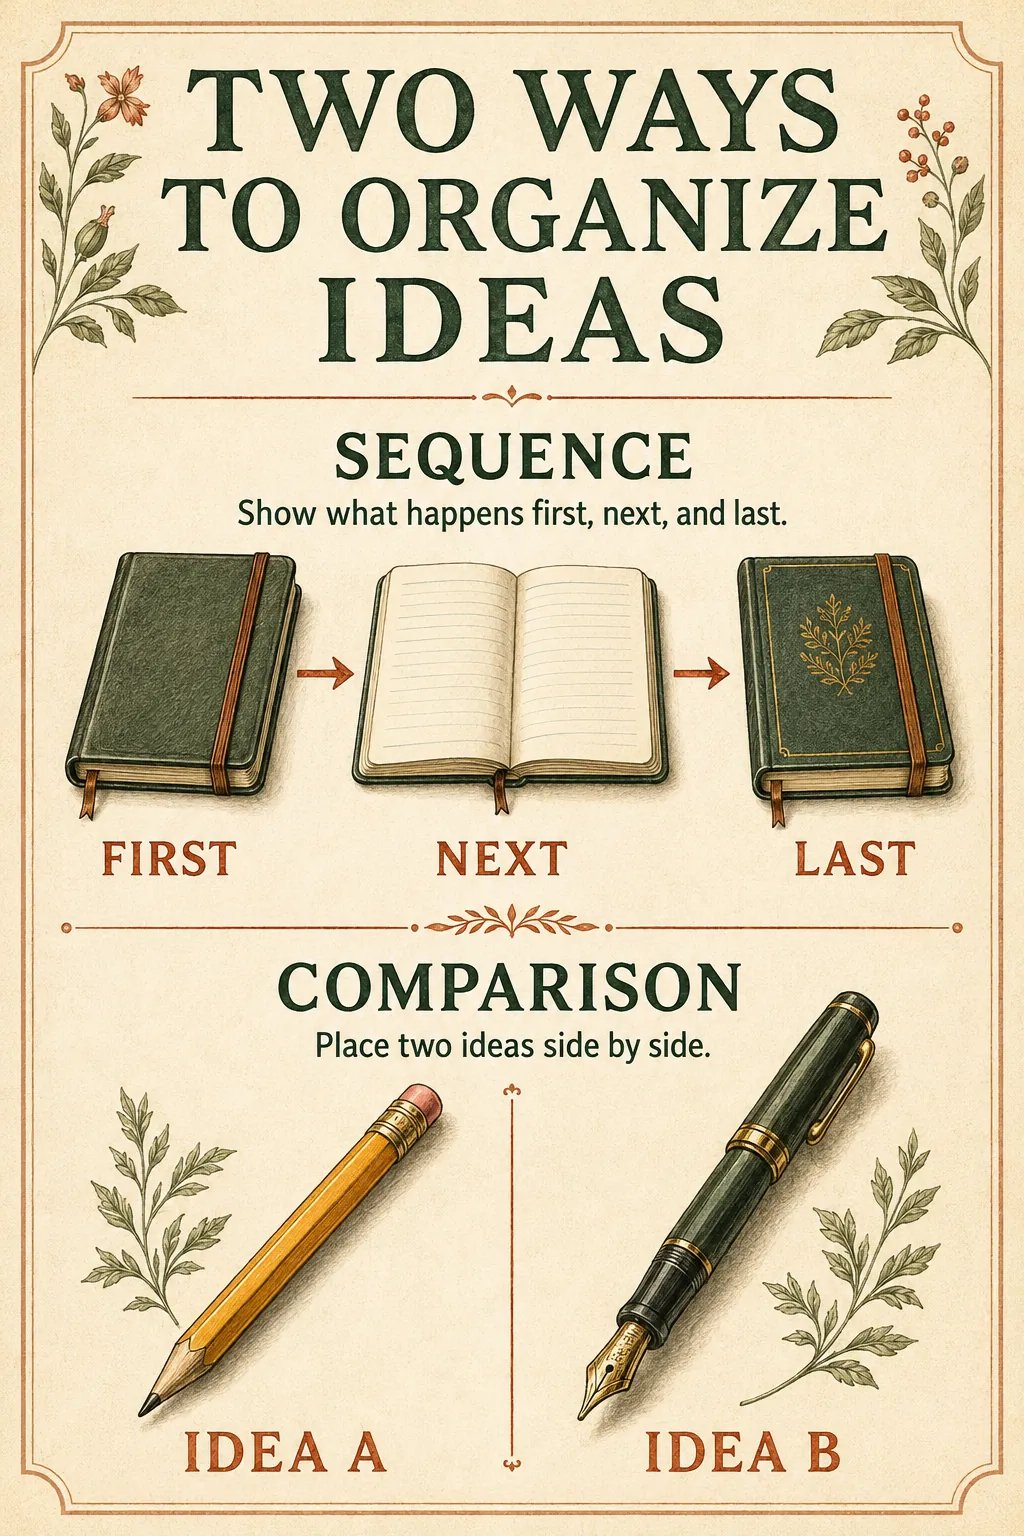
A focused workspace for visual explanations
Your notes are the starting point
Supply the facts, names, and wording you want to include. Keep the content focused on one topic.
Layout directions you can change
Use the prompt chips to suggest a structure, then describe the colors, illustrations, and labels in your own words.
One complete portrait image
Create a single illustrated explanation with GPT Image 2. Check the model’s credit cost beside the generate button.
Go from text to infographic in three steps
Write a title and key points
Paste a short title and three to six points. Check your source information before adding it.
Describe the visual structure
Choose steps, a comparison, or an illustrated explanation. Ask for short labels, clear spacing, and a reading order.
Generate, then review
Sign in, check the credit cost, and generate. Review spelling, facts, numbers, and relationships before sharing.
What will you explain?
Lesson notes
Turn a short reading or topic outline into an illustrated recap for a lesson.
Process explainers
Show the stages of a project, routine, or workflow with numbered steps.
Idea comparisons
Put two concepts side by side using matching categories and concise labels.
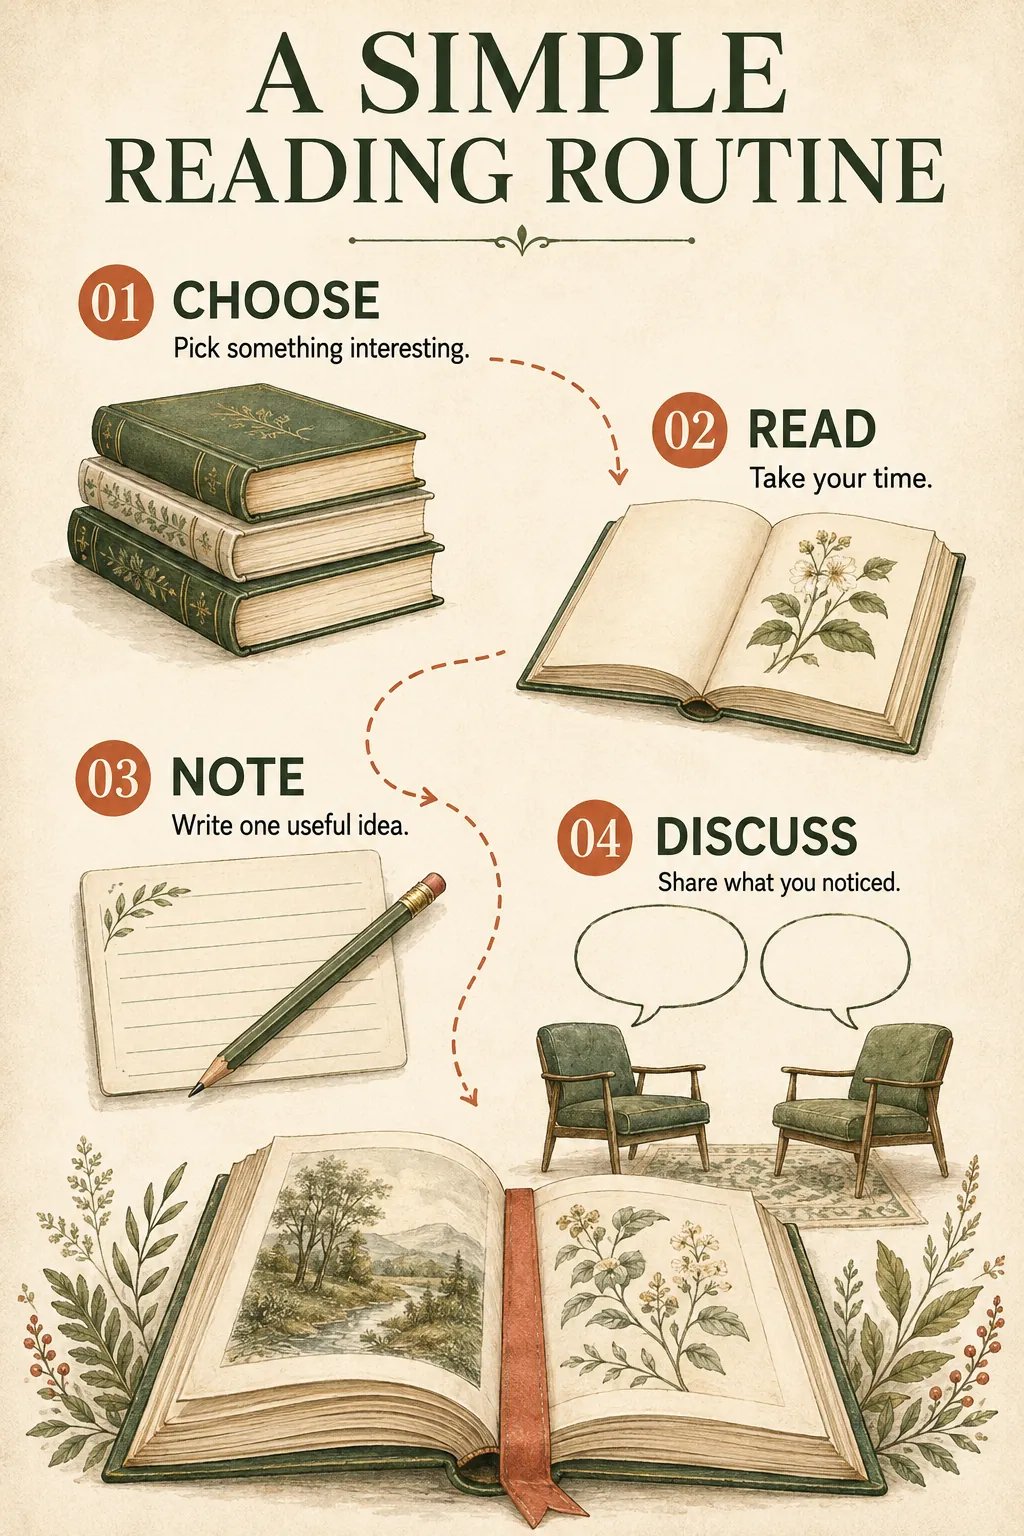
Make your next explanation visual
Bring your title and key points. Start with an example, then make the prompt your own.
Create an infographicAI infographic generator questions
Can I use my own text?
Yes. Paste a title and the points you want the image to explain. You can replace the example prompt entirely or change its wording and visual directions.
Can I edit individual labels after generation?
nabn operates on a flexible credit model with plans starting from $20 for 1,000 credits up to high-volume creator tiers ($999). Generating images costs 16-18 credits per variant (~$0.32-$0.36 on standard plans), with complete commercial licensing included for all generated assets.
Should I check the facts and numbers?
Yes. Review the text, numbers, and relationships before sharing. Image generation can introduce mistakes and does not verify your sources. Use a dedicated charting tool when exact data plotting matters.
Does generation require an account and credits?
Yes. Sign in and check the selected model’s displayed credit cost before generating. Available credits and account options are shown in your account.